Suppressing the noise in ratio images due to low ion counts
2017-11-04:
The images of my ion counts (e.g., 12C14N and 12C15N) look beautiful, but when I make a ratio image (e.g., 12C15N/12C14N), it does not look so pretty because there are a lot of noisy pixels in areas where the ion counts are low. Could I overcome this aesthetic issue, for example, by modulating in every pixel the hue, which represents the value of the ratio according to the color map used, in such a way that the hue intensity will be proportional to the ion count? If I could do this, the noisy information would still be there but not visible in such a prominent way.
Possible solution
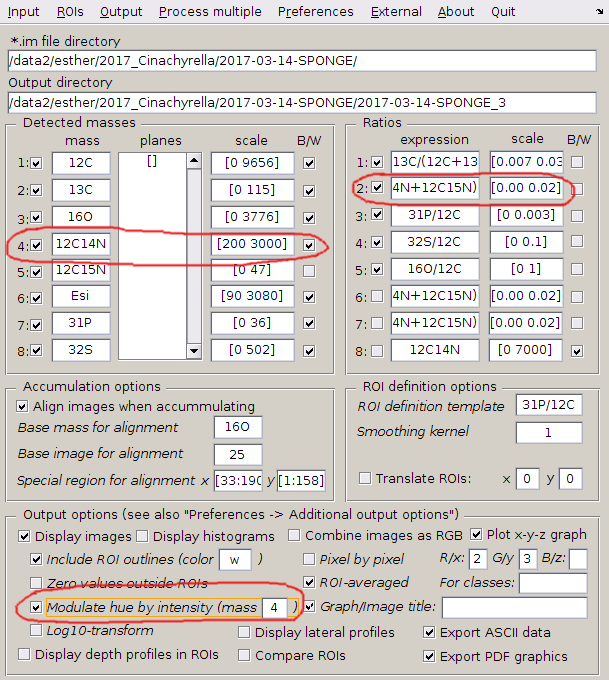
When displaying a ratio image, check the Modulate hue by intenity option in the main LANS GUI, and decide which mass will be used as the factor modulating the hue intensity.
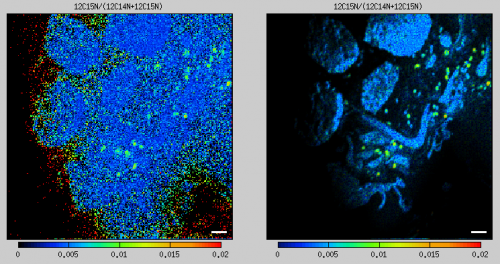
An example of the result before and after the application of this modulation is shown in the left and right image below, respectively.
Example
In this example we will use data kindly provided by Esther van der Ent. It is assumed that the data have been loaded into LANS, aligned and accumulated, and that we want to modify the appearance of the 15N/(14N+15N) ratio image.
- Enter the expression 12C15N/(12C14N+12C15N)
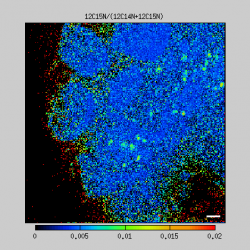 in one of the ratio expression fields in the main LANS GUI, and specify the scale in which you want to display this ratio (e.g., [0 0.02]). Without hue intensity modulation, the ratio image will look noisy and have many red (apparantly oversaturated) pixels, as shown in the image to the right. This is, clearly, due to the fact that when the CN- ion counts are very low, the confidence of the 15N/(14N+15N) ratio is low and thus appears noisy when displayed as an image. In some pixels, the calculated ratio can be so high that it exceeds the maximum of the given scale and thus appears red. This occurs when the measured 12C14N ion counts are very low (almost zero) while the measured 12C15N ion counts are, by coincidence, around 1.
 - To manipulate how this noise is visually perceived in a displayed ratio image, check the Modulate hue by intensity option in the main LANS GUI. This will allow you to display the ratio image in such a way that the intensity of the hue, i.e., the brightness of the actual color, will be multiplied - pixel-by-pixel - by a factor between 0 (minimum intensity) and 1 (maximum intensity) calculated from the measured ion counts and the scale specified by the user. This factor is hereafter denoted as HI (hue intensity) and determined as described in the following.
- If the mass next to the Modulate hue by intensity checkbox is left empty, HI is calculated from the denominator in the displayed ratio. Thus, since the ratio in our example is 12C15N/(12C14N+12C15N), HI is calculated from the sum of the 12C14N and 12C15N ion counts. If the ratio were 13C/(12C+13C), HI would be calculated from the sum of the 12C and 13C ion counts.
- Alternatively, you can use a specific mass to calculate the HI factor and apply it to any ratio image. For example, if you want to display a given ratio only in pixels where, specifically, the 12C14N ion counts are high, enter the ID number of this mass (in this case number 4) to the (mass [ ]) field next to the checkbox (see image above).
- As mentioned above, HI is a factor between 0 and 1 calculated from the measured ion counts and the scale specified by the user. How exactly does this work? First, we use the scale of the 12C14N and 12C15N ion counts determined by auto-scaling (calculated via Input → Autoscale accumulated images). In this example, the minimum and maximum values of the sum 12C14N+12C15N is determined as 0 and 10300, respectively, and in this scale the image of 12C14N+12C15N looks as shown in the left panel of the image below. Thus, in this case, HI is calculated as (12C14N+12C15N)/10300. In pixels where this ratio would exceed 1, it is forced to be 1, whereas in pixels where this ratio would be below 0, it is forced to be zero. Thus, by multiplying the original ratio image 12C15N/(12C14N+12C15N) (middle panel in the image below) with this HI image, the result looks as shown in the right panel in the image below.
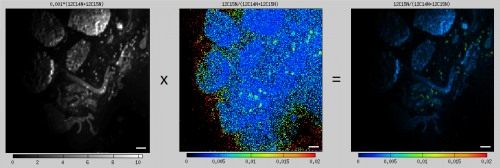
- One can argue that this result looks too dark, which is clearly due to the maximum scale of the 12C14N+12C15N ion counts being too high. To improve the appearance, we modify the scale of the 12C14N ion counts and use this mass as the source of the HI factor. To do this, we enter
4in the (mass [ ]) field in the main LANS GUI (see image above). Then, by entering[200 2000]as the scale of the 12C14N ion counts, HI is calculated as (12C14N-200)/(2000-200), with 1 and 0 being forced in pixels where 12C14N>2000 and 12C14N<200, respectively. In this way the HI image will appear oversaturated and undersaturated at the same time, but it will help us highlight areas in the image where the biomass is high and suppress areas where the biomass is low (see left panel of the image below). By multiplying the original ratio image 12C15N/(12C14N+12C15N) with this HI image, the result will look as follows.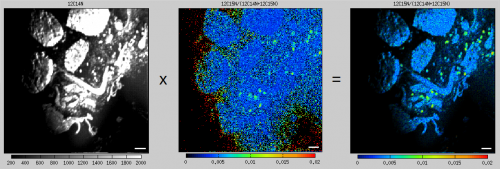 Examples of other ratio image pairs without and with the hue modulation applied are shown below. In all cases the same source for the HI image, namely the 12C14N ion image scaled betwee 200 and 2000, was used.
Few notes
- Note that hue intensity modulation does not modify the actual data. However, it does manipulate how they are visually perceived in a displayed image. Thus it must be applied carefully and responsibly.
- The color map of the image displayed with the modulated hue is slightly different from the color map of the image without hue modulation. Specifically, the color corresponding to the lowest values is about 10% higher in the colormap for the former in comparison to the latter image. For example, when using the Cameca color map, the colormap starts with black for the lowest values. When the image is displayed with hue modulation, the colormap will start with blue for the lowest values. This is to avoid visual confusion between the colored pixels with very low intensity (which will appear essentially black) and pixels with very low ratio values (which will appear blue, if the hue is sufficiently intense).
