Sidebar
nanosims:lans_extras
Table of Contents
New features in LANS
Since its first release in 2011, LANS has been enhanced in numerous ways with features that are useful in different kinds of situations depending on how you wish to look at nanoSIMS data. The overall approach to the analysis, however, did not change. Therefore it is recommended that you first look at the manual to get started with the first steps of data processing and analysis with LANS. In this page you will find a list of features that are not mentioned in the manual but are useful to be aware of when using LANS. Many of them are explained in greater detail to ensure you understand how to use them correctly.
Suppressing the noise in ratio images in pixels with low ion counts
The images of my ion counts (e.g., 12C14N and 12C15N) look beautiful, but when I make a ratio image (e.g., 12C15N/12C14N), it does not look so pretty because there are a lot of noisy pixels in areas where the ion counts are low. Could I overcome this aesthetic issue, for example, by modulating in every pixel the hue, which represents the value of the ratio according to the color map used, in such a way that the hue intensity will be proportional to the ion count? If I could do this, the noisy information would still be there but not visible in such a prominent way. How can I do this?

Working with external images
In addition to nanoSIMS images, I have imaged the same field of view (FOV) also with another instrument (e.g., fluorescence microscope, AFM, SEM, TEM). I would like to analyze these images together. Specifically, I would like to align them, overlay them, extract lateral profiles, define ROIs based on the external image and calculate ion count ratios in these ROIs, etc. How can I do this?

Auto-processing multiple datasets
I have analyzed 10 nanosims datasets. For each dataset I accumulated the planes (sometimes with, sometimes without the drift-correction applied), defined and classified ROIs, and exported images and data in ROIs for 13C/12C and 12C15N/12C14N ratios. However, now I realize that I also need to calculate and analyze the 31P/32S ratios as well as the cell sizes. Plus I would like to display all ratio images together, using a unified scale for all images for a given ratio. Can I do this without re-processing each file separately?
Depth profiles in ROIs from multiple datasets
I have analyzed 10 datasets. In each dataset I defined ROIs, classified them, and calculated 13C/12C and 12C15/12C15N ratios in each ROI. Now I realize that I also need to check depth profiles of these ratios in each ROI to quantify their vertical variability within the sample. I could do it by reprocessing each dataset again, but I think there should be a more efficient way using the metafile processing. How can I do this?
Watershed segmentation of ROIs
My nanosims image shows a larger 'blob' of relatively high but quite variable ion counts. I would like to use some automated image processing tool, such as watershed segmentation, to segment this pattern into several smaller ROIs? How can I do this?

Display ROIs with a specific ID or from a specific class
I have defined many ROIs and classified them into several classes. After I made a scatter plot of ratios in these ROIs, I identified a few 'odd' datapoints. I would like to quickly display the ROIs corresponding to these 'odd' datapoints. How can I do that?
Quick answer
In the Interactive ROIs definition tool, click on Display ROIs in the menu. In the window that pops up, specify the ID numbers of ROIs (separated by space) and ID letters of ROI classes that you wish to display. Enter empty to display all defined ROIs.

Annotated scatter plots
When processing multiple NanoSIMS datasets, I end up with a scatter plot of ratios in many different ROIs for a number of different treatments. I would like to be able to interact with this scatter plot, for example, by being able to click on a datapoint to find its identity and origin. How do I do that?

Scatter plots of ratios in ROIs - pixel-by-pixel in color and as 2D-histograms
I would like to display an x-y scatter plot not using the ratio values derived from ion counts accumulated in ROIs but using the pixel-by-pixel ratio values. I want to include only those pixels that belong to ROIs that I have drawn and classified, and I want the data-points in the scatter plots to be color-coded based on the ROI classes. How can I do that?

Scatter plots in ROIs from specific classes
I have defined many ROIs and classified them into several classes. When I display a scatter plot of ratios in these ROIs, the graph looks overcrowded due to too many datapoints. I would like to focus my attention separately on ROIs from specific classes, leaving the ROIs from other classes out of the scatter plot. How can I do that?
Quick answer
There is a text field in the main LANS GUI, called For classes. Type here the names of the ROI classes you want to display in the scatter plot. When displaying the scatter plot, only datapoints corresponding to ROIS from these classes will be shown. For example, if you have classified your ROIs into three classes, a, b and c. and you want to display datapoints only for ROIs from classes a and c, type ac in the For classes field.
Display ratios for each plane
Seeing ratio images calculated from accumulated ion images is nice, but because I expect depth variation I would like to look at the ratio images separately for each plane. How can I do that?
Quick answer
Select Output → Display ratios for each plane from the main LANS GUI. This will open a dedicated GUI (see image below), where you can navigate through the different planes, select a colormap, and export each or all planes in a PNG graphic format. The color scaling of the images is determined based on the values given in the corresponding scale fields of the main LANS GUI.

Processing of huge IM files
I have a very large *.im file (>700MB) and my computer does not seem to be able to process it at once, most likely due to limited memory. I would like to process the data in parts, for example by loading only specific masses or specific planes. How can I do that?
Merging multiple IM files
I acquired ion count images from the same field of view (FOV) several times. Now I would like to merge these multiple *.im files and analyze them at once. How do I do that?
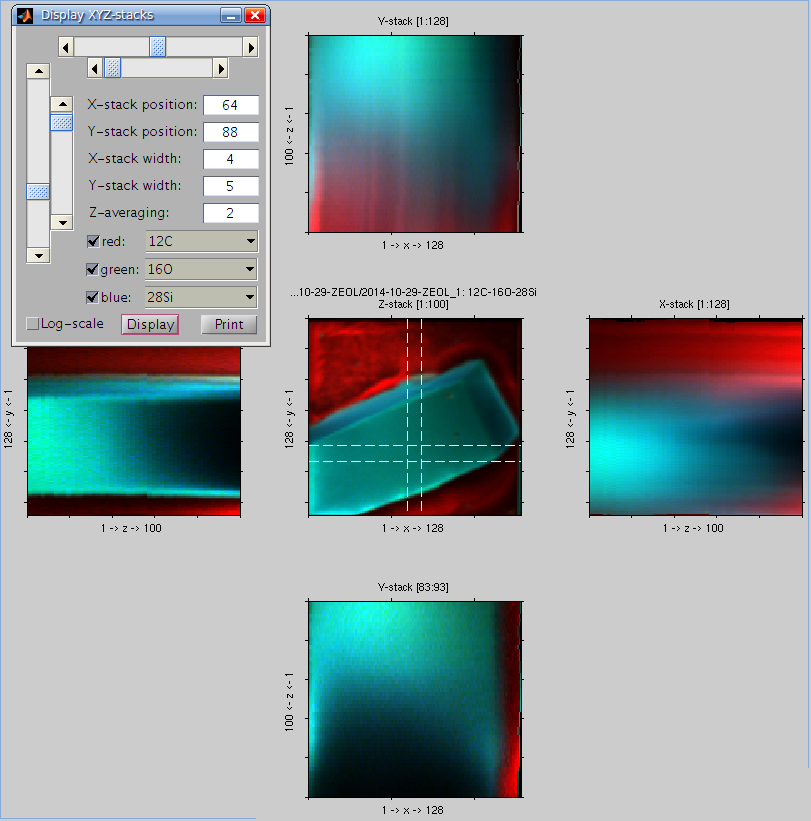
Display XYZ stacks
Nanosims data acquired in the image mode form a 3-dimensional data-cube, where the detected ion counts vary as a function of the lateral (X and Y) and vertical (Z) co-ordinates. I would like to be able to display this variation. How can I do that?
Definition of ROIs through a logical expression
I would like to define ROIs (regions of interest) as contiguous groups of pixels that satisfy a certain condition. For example, I want to use the 12C14N image as a template for ROI definition, and define ROIs by selecting all pixels where the accumulated 12C14N- ion counts are larger than 3000. How can I do that?
Interactive thresholding on an inverted image
In the Interactive ROI definition tool I use a lot the interactive thresholding function to define ROIs corresponding to the bright areas in my ion image. However, sometimes the bright areas have a dark spot inside it, which I would like to remove by the same interactive thresholding approach. However, I don't seem to be able to do this because this function marks a contour around a “hill” rather than a “valley” in the image data. What can I do?
Quick answer
In the Action menu of the Interactive ROI definition tool, there is a new item named Invert template image. If you select it, the image based on which you define ROIs will be inverted, meaning that hills will become valleys and vice versa. After doing this, you can use the Interactive thresholding function from the menu to define the ROIs as you are used to. Note, however, that the present value of the threshold may be too high or too low for getting a good ROI outline straight away. In this case, press arrow up or down while performing the interactive thresholding function to modify the threshold and thus change the shape and size of the defined ROI.

Definition of lateral profiles by co-ordinates
I am able to define the line for plotting lateral profiles  of ion counts and ratios using mouse. Although this is mostly sufficient, sometimes I need to define this line more accurately using co-ordinates of the start and end points of the line. How can I do that?
Quick answer
This is done by entering the co-ordinate values in the [x1,y1] and [x2,y2] fields in the GUI used for plotting of lateral profiles (see image below).
Removing multiple ROIS based on size
I have too many ROIs with size in a specific range and I would like to remove them all at once. For example, I want to remove all ROIs that are smaller than 5 pixels. How can I do that?
Depth profile along a lateral profile
I have measured ion counts in the same FOV (field of view) over multiple scans (each containing 1000 planes) until the biomass was, essentially, completely eroded. I would like to visualize depth distribution of the isotope ratio along a specific lateral profile within the image. How can I do that?
Quick answer
This feature was applied in the studies of Geerlings et al. (2021, 2022) to visualize the distribution of C and N assimilation and polyphosphate dynamics in cable bacteria. Examples of the output are shown in the following images. Follow this link to learn how to do it in Look@NanoSIMS.

Geerlings et al. (2021). Cell Cycle, Filament Growth and Synchronized Cell Division in Multicellular Cable Bacteria. https://www.frontiersin.org/articles/10.3389/fmicb.2021.620807/full

Geerlings et al. (2022). Polyphosphate Dynamics in Cable Bacteria. https://www.frontiersin.org/articles/10.3389/fmicb.2022.883807/full
nanosims/lans_extras.txt · Last modified: 2022/09/06 09:07 by lpolerec
Page Tools
Except where otherwise noted, content on this wiki is licensed under the following license: CC Attribution-Noncommercial-Share Alike 3.0 Unported
