User Tools
Writing /www/virtual/nanosims/nanosims-wiki/data/cache/f/fe574220e1d908dff38bbfa5a3b058cd.i failed
Unable to save cache file. Hint: disk full; file permissions; safe_mode setting.
Writing /www/virtual/nanosims/nanosims-wiki/data/cache/f/fe574220e1d908dff38bbfa5a3b058cd.metadata failed
Sidebar
nanosims:lans_extras:annotated_scatter_plots
Writing /www/virtual/nanosims/nanosims-wiki/data/cache/f/fe574220e1d908dff38bbfa5a3b058cd.i failed
Unable to save cache file. Hint: disk full; file permissions; safe_mode setting.
Writing /www/virtual/nanosims/nanosims-wiki/data/cache/f/fe574220e1d908dff38bbfa5a3b058cd.xhtml failed
Annotated scatter plots
2014-11-27:
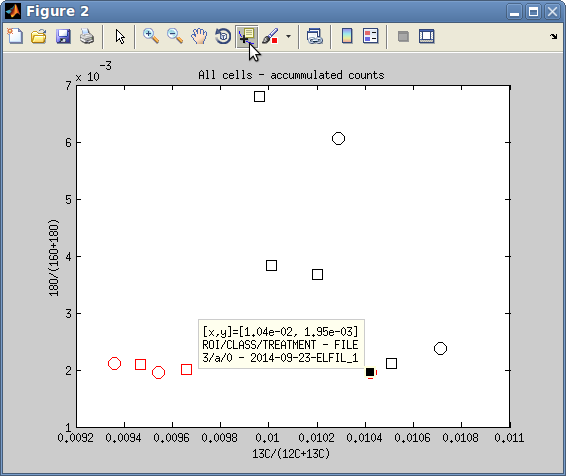
When processing multiple NanoSIMS datasets, I end up with a scatter plot of ratios in many different ROIs for a number of different treatments. I want to be able to interact with this scatter plot, for example, to find out the identity of an apparent outlier.
Possible solution
- X-Y scatter plots of ratios from multiple datasets are made through the so-called metafile processing function in LANS. This function is executed through the dedicated GUI accessible via Process multiple → Process metafile.
- Once the plot is displayed (see image below), activate the viewing of annotations by clicking on the Data Cursos (see the mouse pointer in the image below).
- Click on any of the displayed data-points to see its properties, which include co-ordinates, ROI identification number, class identification letter, treatment identification number, and the name of the *.im file where the ROI corresponding to that data point was defined.
nanosims/lans_extras/annotated_scatter_plots.txt · Last modified: 2017/11/16 04:59 by lpolerec
Page Tools
Except where otherwise noted, content on this wiki is licensed under the following license: CC Attribution-Noncommercial-Share Alike 3.0 Unported


