User Tools
Writing /www/virtual/nanosims/nanosims-wiki/data/cache/c/cdcd33f69ab314d063d7007935fb8488.i failed
Unable to save cache file. Hint: disk full; file permissions; safe_mode setting.
Writing /www/virtual/nanosims/nanosims-wiki/data/cache/c/cdcd33f69ab314d063d7007935fb8488.metadata failed
Sidebar
nanosims:lans_extras:display_xyz_stacks
Writing /www/virtual/nanosims/nanosims-wiki/data/cache/c/cdcd33f69ab314d063d7007935fb8488.i failed
Unable to save cache file. Hint: disk full; file permissions; safe_mode setting.
Writing /www/virtual/nanosims/nanosims-wiki/data/cache/c/cdcd33f69ab314d063d7007935fb8488.xhtml failed
Display XYZ stacks
2014-11-21:
Nanosims data acquired in the image mode form a 3-dimensional data-cube, where the detected ion counts vary as a function of the lateral (X and Y) and vertical (Z) co-ordinates. I want to be able to display this variation.
Possible solution
- After loading the *.im file, select Display XYZ stacks from the Input menu of LANS.
- Using the dedicated GUI that pops up you can display different X-Z and Y-Z sections of the ion count hypercube. It is possible to do this for an individual ion mass or for up to 3 ion masses combined into an RGB image, depending on which of the 3 color checkboxes are selected.
Example
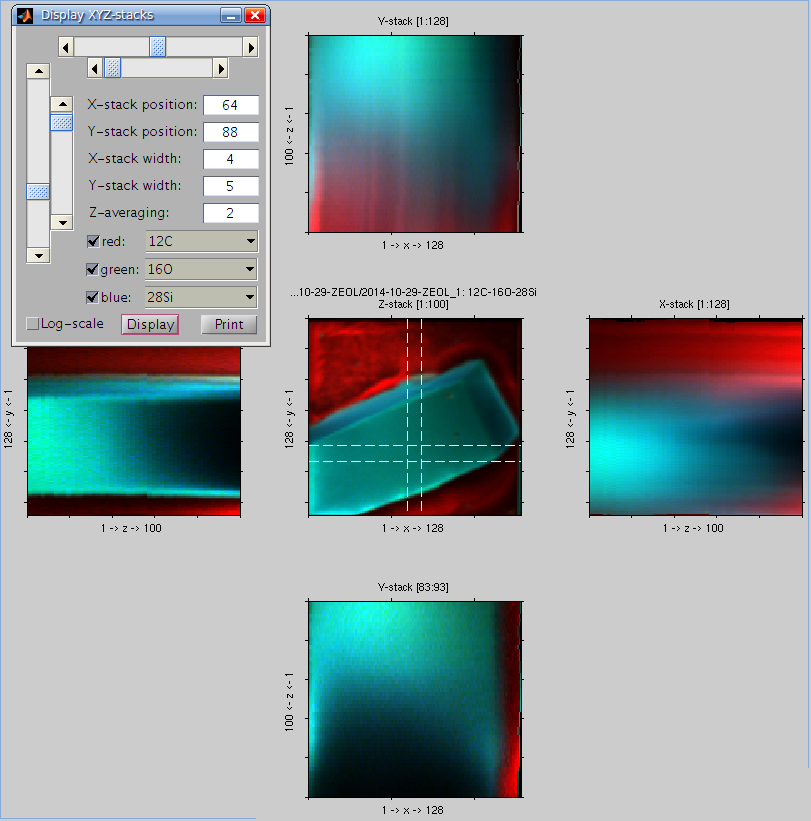
Example of the XYZ stack output is shown in the image below.
- The central image shows the data-cube stacked in the Z-direction, i.e., the usual view of the NanoSIMS image data (Z-stack).
- The top image shows the data-cube stacked over all pixels in the Y-direction (Y-stack), thus showing how the data vary on average in the X-Z plane.
- The right image shows the data-cube stacked over all pixels in the X-direction (X-stack), thus showing how the data vary on average in the Y-Z plane.
- To see the variability in the Y-Z and X-Z planes over thinner sections, select the location and thickness of these sections using the sliders or by specifying them directly in in the corresponding field. The thinner X- and Y-stacks are then displayed in the left and bottom image, respectively.
Notes
- When moving the sliders with the mouse, be careful not to move them too fast. If you do so, the display may not respond, and your LANS session may even freeze.
- If you display the X-Z and Y-Z stacks before you align the measured planes, you will be able to check the extent of the lateral variation in the sample (e.g., due to a drift during the measurement, or due to a true lateral variability in the sample).
- If you display the X-Z and Y-Z stacks after you have aligned the measured planes, you will be able to check the quality of the alignment done by LANS.
nanosims/lans_extras/display_xyz_stacks.txt · Last modified: 2017/11/16 04:41 by lpolerec
Page Tools
Except where otherwise noted, content on this wiki is licensed under the following license: CC Attribution-Noncommercial-Share Alike 3.0 Unported
