User Tools
Writing /www/virtual/nanosims/nanosims-wiki/data/cache/5/55a7672af93ea073b14885ffb8e73462.i failed
Unable to save cache file. Hint: disk full; file permissions; safe_mode setting.
Writing /www/virtual/nanosims/nanosims-wiki/data/cache/5/55a7672af93ea073b14885ffb8e73462.metadata failed
Sidebar
nanosims:lans_extras:pixel_by_pixel_scatter_plots
Writing /www/virtual/nanosims/nanosims-wiki/data/cache/5/55a7672af93ea073b14885ffb8e73462.i failed
Unable to save cache file. Hint: disk full; file permissions; safe_mode setting.
Writing /www/virtual/nanosims/nanosims-wiki/data/cache/5/55a7672af93ea073b14885ffb8e73462.xhtml failed
Plotting ratios in ROIs - pixel-by-pixel in color and as 2D-histograms
2013-01-05:
I want to display an x-y scatter plot not using the ratio values derived from ion counts accumulated in ROIs but using pixel-by-pixel ratios values. I want to include only those pixels that belong to ROIs that I have drawn and classified, and I want the data-points in the scatter plot to be color-coded based on the ROI classes.
Possible solution
- In the R/x and G/y fields of the main LANS GUI, specify the ID numbers of the ratios that should be used as the x and y values in the scatter plot.
- Check Plot x-y-z graph and Pixel by pixel options in the main LANS GUI, and uncheck the ROI-averaged option.
- Select Output → Display Ratios from the Output menu of LANS.
- When asked, select the dat file containing the classification information of the defined ROIs.
Example
- The expressions 31P/(12C+13C) and 32S/(12C+13C) are entered as the ratio expressions 3 and 4. Thus, we type 3 and 4 in the R/x and G/y fields, respectively.
- The images of these ratios, and the corresponding pixel-by-pixel scatter plots, are shown below.
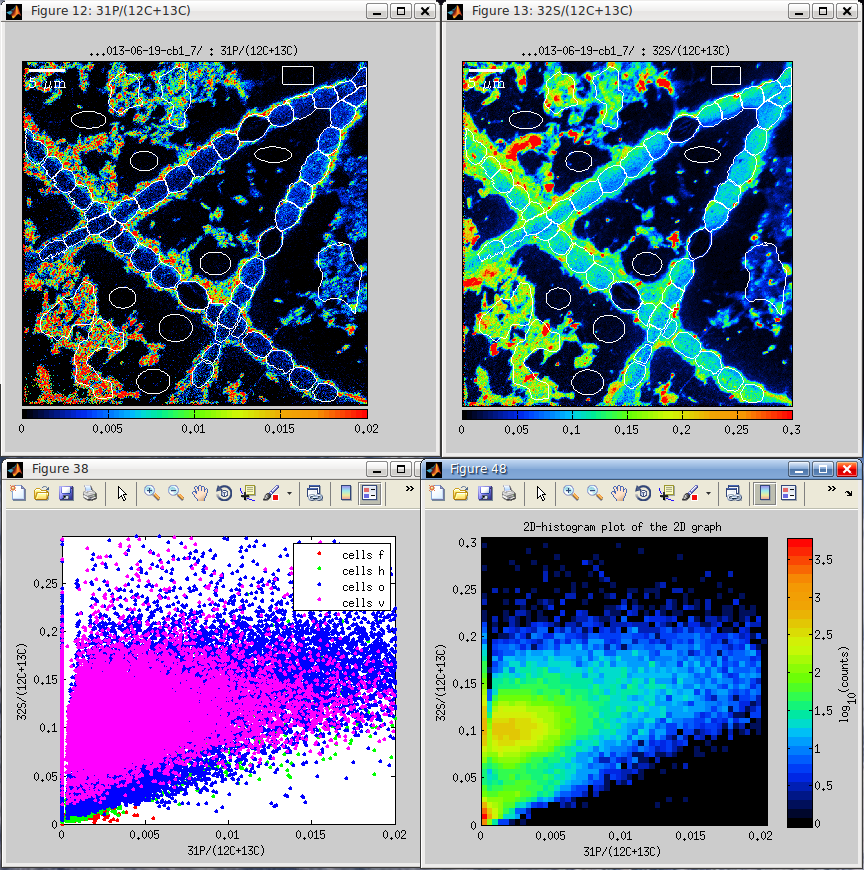
Few notes
Because the number of pixels in the defined ROIs is usually large, the x-y graphs may not always be very informative (e.g. they may form several indiscernible clouds). Therefore, in addition to the x-y graph, the density of the pixels in the x-y graph is also shown as a 2D histogram (see image above). The default number of bins in this 2D histogram is 50 for both x and y dimensions.
nanosims/lans_extras/pixel_by_pixel_scatter_plots.txt · Last modified: 2017/11/15 16:11 by lpolerec
Page Tools
Except where otherwise noted, content on this wiki is licensed under the following license: CC Attribution-Noncommercial-Share Alike 3.0 Unported
